
- Summary:
- MicroAlgo surges 173% to $10.12 in a stunning breakout. What’s driving the rally—and can it last? Full analysis and key levels inside.
Table of Contents
MicroAlgo Inc. (NASDAQ: MLGO) is back in the spotlight, exploding 173% to $10.12 at the time of writing, in a move that has stunned both retail traders and market analysts. The stock has become one of the top gainers on Wall Street today, drawing massive volume and surging interest across trading forums and finance platforms.
But with such a sudden vertical spike, is this a short-lived pump—or the start of something bigger?
Why Is MLGO Stock Skyrocketing?
While no official press release has been issued today, the price action suggests speculative momentum fueled by retail interest and low float dynamics.
Possible Catalysts:
- Low Float Setup: With limited supply of tradable shares, any increase in buying volume can lead to massive spikes.
- Retail-Fueled Hype: MLGO has become one of the most viewed tickers on social platforms and retail forums like StockTwits and Reddit.
- Short Squeeze Potential: With the stock’s history of volatility, traders may be covering short positions aggressively.
This isn’t the first time MLGO has moved like this. The stock spiked above $450 in mid-2023 during a short-lived squeeze before collapsing—making today’s rally both exciting and risky.
Technical Breakdown: Is the Rally Sustainable?
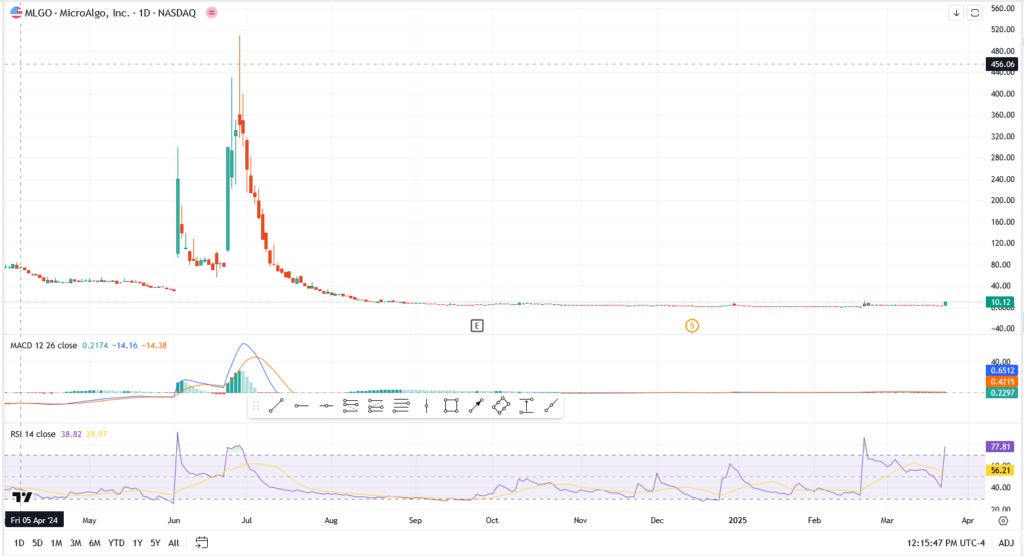
Today’s breakout is reminiscent of MLGO’s infamous 2023 spike—when shares briefly touched $456 before collapsing. That context matters: while today’s gain is eye-popping, it also comes with high risk.
Price Action Overview:
- Current Price: $10.12 (at time of writing)
- Previous Price Level: $3.70 (early session low)
- Intraday Surge: Approx. 173.5%
- MACD: Gaining bullish momentum, but far below baseline
- RSI: 77.81 – overbought, signalling potential pullback soon
Key Levels to Watch:
- Immediate Resistance: $12.50 – minor ceiling from post-crash bounce zones
- Major Resistance: $18.00 – historical retrace level from 2023
- Support Zone: $6.50 – psychological midpoint
- Critical Floor: $3.70 – breakout base; any drop below this would be a bearish reversal signal
Is MLGO a Momentum Trade or Pump-and-Dump?
Let’s be blunt: MLGO’s chart history raises red flags. After its parabolic spike in 2023, the stock collapsed by over 90% within weeks. That’s why today’s move—while technically impressive—needs to be viewed through a cautious lens.
Risk Factors
- No clear fundamental driver
- Extremely low float = extreme volatility
- Past history of unsustainable spikes
Traders speculating on MLGO should use tight stops and expect sharp reversals. This is not a value play—it’s pure momentum.
Is This a Sustainable Move or a Trap?
Given MLGO’s past parabolic spike and crash, today’s rally raises eyebrows. The absence of fundamental news suggests this is being driven purely by technical momentum, trader hype, and speculative flow.
Historical Warning Signs:
- In June 2023, MLGO soared to $456 and then collapsed by over 95%
- Since then, the stock traded near penny stock levels before today’s breakout
Unless a real catalyst or corporate update emerges, this rally could lose steam just as quickly as it ignited.
Final Thoughts
MLGO’s explosive 173% rally to $10.12 is grabbing headlines—but savvy traders know these moves come with serious risk. Without a confirmed catalyst, this could be a classic low-float pump-and-dump or a setup for short-term scalps only.
If you’re watching MLGO, keep a close eye on volume, RSI levels, and major support zones. Tight stops and smart risk management are non-negotiable in this kind of volatility.