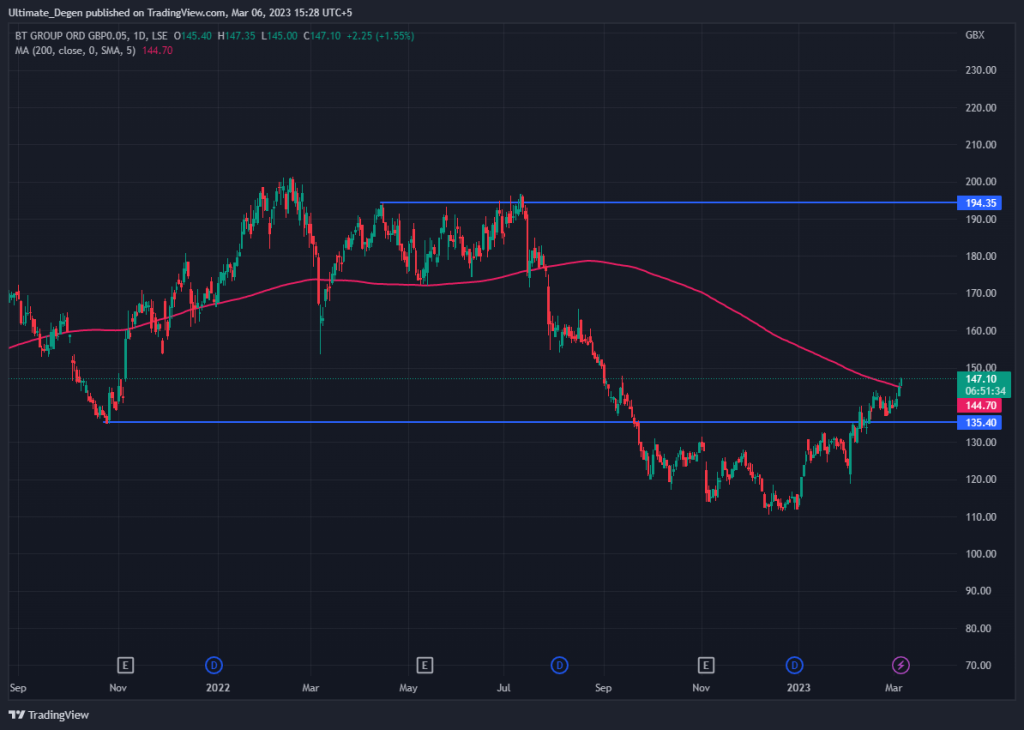
BT share price (LON: BT) has been performing well since the start of this year. During this time, the price has gained 30% after reclaiming the November highs of 131.4p. On Monday, BT shares are having the 4th consecutive green day by gaining another 1.23%. This also marks a new yearly high for the British telecom giant.
FTSE 100 index showed a negative price action in the opening hours and slid by 0.42%. Nevertheless, the BT share price still maintained its uptrend and continued the ascent. At press time, LON: BT-A is trading at 146.7p after gaining 1.23%.
Deutsche Telekom is considering winding down its stake in BT Group plc, which is a major concern for investors. The firm’s Q3 financials were also not that impressive, as most of its core segments saw a decline in revenue. Nevertheless, Openreach quarterly revenue still increased by 5% on a YoY basis.
BT share price is surging because its Openreach fibre laying is leading the race of country-wide network upgrade. BT’s subsidiary Openreach has already laid fibre to 9.6 million facilities which have given the firm a competitive edge. However, the cash-flooded competitors are also speeding up their upgrades to support 5G. The former telecom monopoly will have to face fierce competition in this race from altnets and Virgin Media O2.
There are certain key levels in the following BT share price chart that can act as major resistance and support. On the daily timeframe, LON: BT appears to have bottomed out in the fall of 2022. The reclaim of the 131.6p level has given the bulls enough confidence to aim for a retest of 200-day MA.
Since the price is retesting 200-day MA, so I expect a slight pullback in the next few days. However, a few daily closures above this key moving average may result in a massive upside move. In this scenario, the 154p level can act as a major resistance as it has acted as strong support previously.


This post was last modified on Mar 06, 2023, 10:42 GMT+0100 10:42