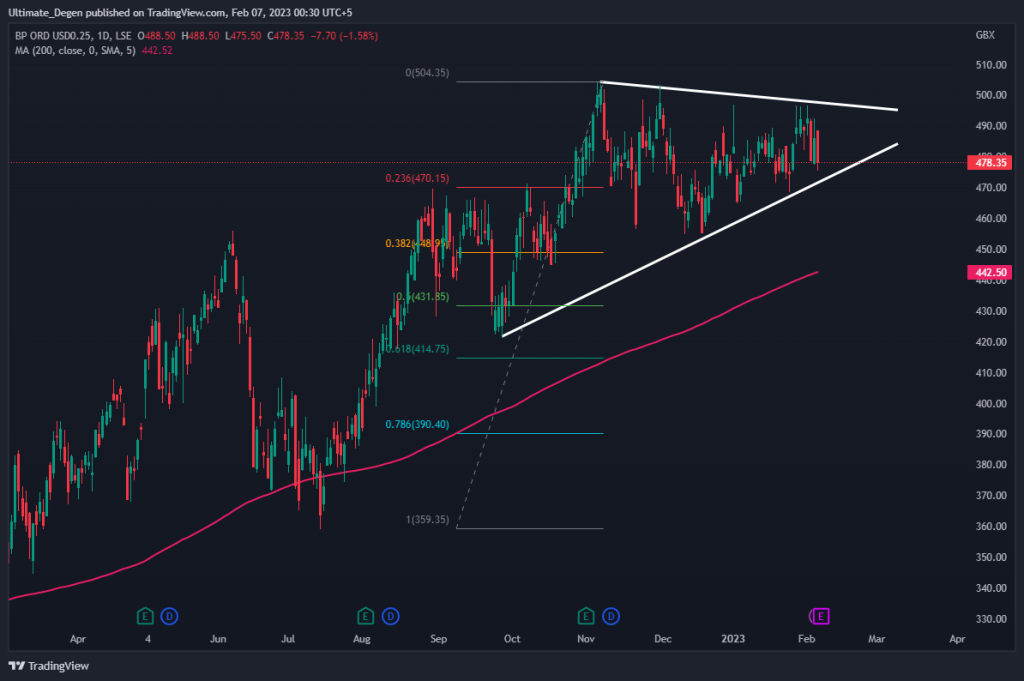
As described in our previous BP share price prediction, the price is still moving sideways. On Monday, UK equities had a rough day as FTSE 100 fell by 65 points. The index covers the 100 biggest stocks of UK and also includes BP. During the London session, BP stock fell by -1.58% wiping off all the gains from Friday’s session.
According to the latest BP news, the company has changed its long-term demand forecast. It also expects the countries to speed up their renewable energy endeavors considering the impact of the ongoing Russia-Ukraine war. The CEO of BP PLC also intends to take a step back from the organization’s massive investments in ESG and renewables. As per Bernard Looney, the returns from these investments have not been encouraging.
BP stock price appears to have been in a massive bull trend since November 2020. The ongoing war has played a very key role in maintaining this uptrend. However, the price appears to be losing some steam now as it approaches the $500 psychological barrier.
On daily and weekly chart BP share price is constantly making higher highs and higher lows. However, the last few weeks’ sideways price action has formed a symmetrical triangle. Many traders don’t trade this pattern until they see a clear breakout. Therefore the upcoming breakout has become very critical as the price approaches to apex. Considering, the pattern breakout strategies, we get to the following two bullish and bearish scenarios.


In case of a daily closure below the symmetrical wedge, the price can continue to dip toward $4.40 level. This price level comes into play due to the confluence of the 0.5 Fib level and the 200-day moving average. After $440, bears can target the September 2022 low of $421.
On the other hand, an upwards breakout can push the price to retest the $500 level once again. Since BP price is in a massive uptrend, an upwards breakout is more likely. But the recent trend exhaustion might result into a correction before the next leg up.
This post was last modified on Feb 06, 2023, 19:42 GMT+0100 19:42