
- Summary:
- Apple stock plunges 12%, marking its worst week since March 2020. With $776B wiped from its market cap....
Table of Contents
- Apple’s Market Rout Deepens as Stock Hits Seven-Month Low
- Why Is Apple Stock Falling?
- Weak iPhone Demand and China Slowdown
- Rising Trade Tensions and Tariff Risks
- Broader Tech Sell-Off and High Valuations
- Apple Stock Chart Analysis – Key Levels to Watch
- Support and Resistance Levels
- Technical Indicators
- Final Thoughts: Will Apple Recover or Keep Sliding?
Apple’s Market Rout Deepens as Stock Hits Seven-Month Low
Apple Inc. (NASDAQ: AAPL) has been facing its worst week since March 2020, plunging over 12% as investor sentiment around Big Tech weakens. The stock is now trading at its lowest level since August 2024, dropping 11 of the past 13 trading sessions.
Since hitting a record high in December, Apple has lost nearly 20% of its value, wiping out approximately $776 billion in market capitalization. The sell-off reflects broader technological sector weakness, ongoing concerns over iPhone demand, regulatory scrutiny, and rising trade tensions between the U.S. and China.
Why Is Apple Stock Falling?
Weak iPhone Demand and China Slowdown
- Apple’s sales in China have struggled, as local competitors like Huawei continue to gain market share.
- Recent reports indicate that iPhone sales in China are down more than 24% year-over-year, adding pressure to Apple’s revenue outlook.
Rising Trade Tensions and Tariff Risks
- Given its reliance on Chinese manufacturing, the U.S.-China trade war has resurfaced as a major risk factor for Apple.
- Concerns over potential tariffs on Chinese exports, including consumer electronics, have weighed on investor sentiment.
Broader Tech Sell-Off and High Valuations
- The Nasdaq Composite is down sharply this month, as investors rotate out of high-growth tech stocks amid uncertainty about a rate cut.
- Apple’s high valuation multiples have made it more vulnerable to this downturn, as investors reassess growth expectations.
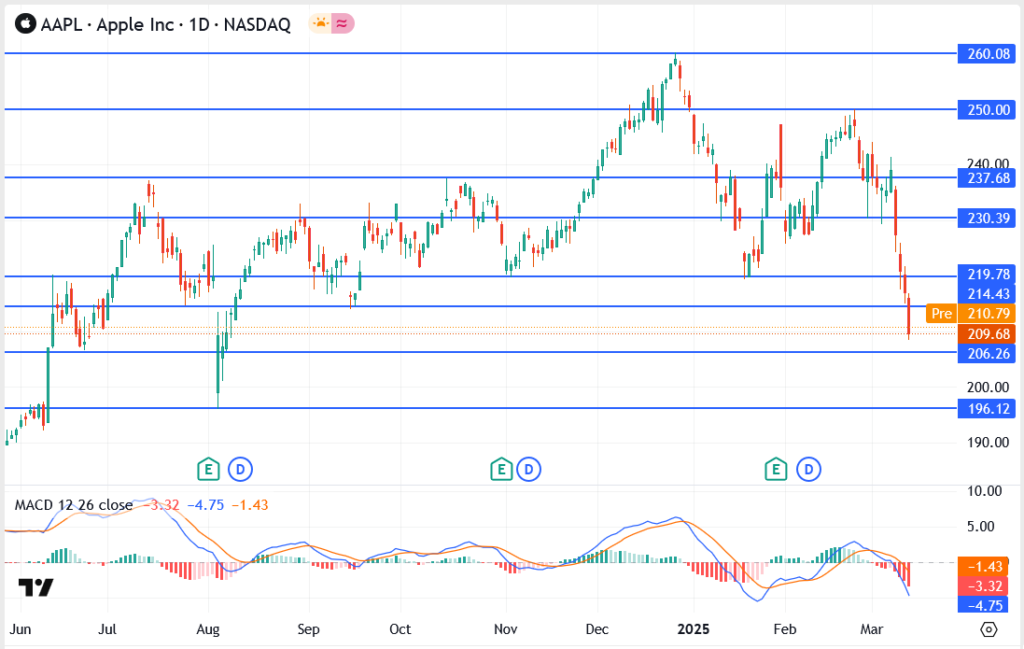
Apple Stock Chart Analysis – Key Levels to Watch
Apple Price pre market: $210.79
1-Week Change: -12%
Market Cap Loss Since December: $776 billion
Support and Resistance Levels
- Immediate Resistance: $214.43 – Needs to reclaim this level to stabilize.
- Major Resistance: $219.78 – $230.39 – Bulls must push above this zone to regain momentum.
- Immediate Support: $209.68 – $206.26 – Key levels that must hold to prevent further downside.
- Major Support: $196.12 – A break below this could trigger a deeper correction.
Technical Indicators
- MACD: Bearish crossover confirms strong downward momentum.
- RSI: Approaching oversold territory, indicating potential for a short-term relief bounce.
- Volume: Heavy selling pressure suggests institutional investors are offloading shares.
Outlook
If Apple holds $209, it may attempt a bounce toward $214-$219. However, failure to hold this support level could push the stock toward $200 and below.
Final Thoughts: Will Apple Recover or Keep Sliding?
Apple’s steep decline reflects growing macroeconomic risks, weakening iPhone sales, and concerns over U.S.-China trade relations. While the stock is nearing oversold conditions, investor sentiment remains fragile as the broader market struggles.
Holding above $209 is critical for a potential rebound.
Regulatory and trade concerns remain key headwinds for Apple.
Tech sector weakness continues to pressure high-valuation stocks.
For now, Apple investors are bracing for more volatility. Will the stock find support, or is another leg lower ahead? Stay tuned here for further developments!