Table of Contents
- $6.6 Trillion Wiped Out: Stock Market Enters Crisis Mode
- What Caused Dow Jones Industrial Average plunge?
- Technical Analysis: Dow Jones Breaks Critical Support
- Key Levels From the Chart:
- RSI Breakdown:
- Wall Street’s Volatility Surge: Worst Since Pandemic Panic
- What’s Next? Bearish Momentum or Rebound Rally?
- Conclusion
Wall Street just witnessed a financial bloodbath. The Dow Jones Industrial Average (^DJI) crashed more than 2,000 points this week, as escalating trade tensions under Donald Trump’s new tariff threats triggered the worst stock market sell-off since the 2020 COVID-19 crash. Investor sentiment turned sharply negative as fears of a renewed US-China trade war resurfaced, dragging the broader market into correction territory.
Over just two sessions, markets lost more than $6.6 trillion in value.
$6.6 Trillion Wiped Out: Stock Market Enters Crisis Mode
- Dow Jones fell 5.5% this week, marking a massive 2,000+ point drop.
- S&P 500 lost nearly 6%, suffering its worst weekly performance in five years.
- Nasdaq Composite tanked 5.8%, officially entering bear market territory.
- Over $6.6 trillion in market value evaporated from global equities in just two trading sessions.
What Caused Dow Jones Industrial Average plunge?
- Trump vowed to impose sweeping tariffs on Chinese imports.
- Investors fear retaliation from China and global trade disruptions.
- Volatility spiked, with safe-haven assets gaining ground.
Technical Analysis: Dow Jones Breaks Critical Support
Key Levels From the Chart:
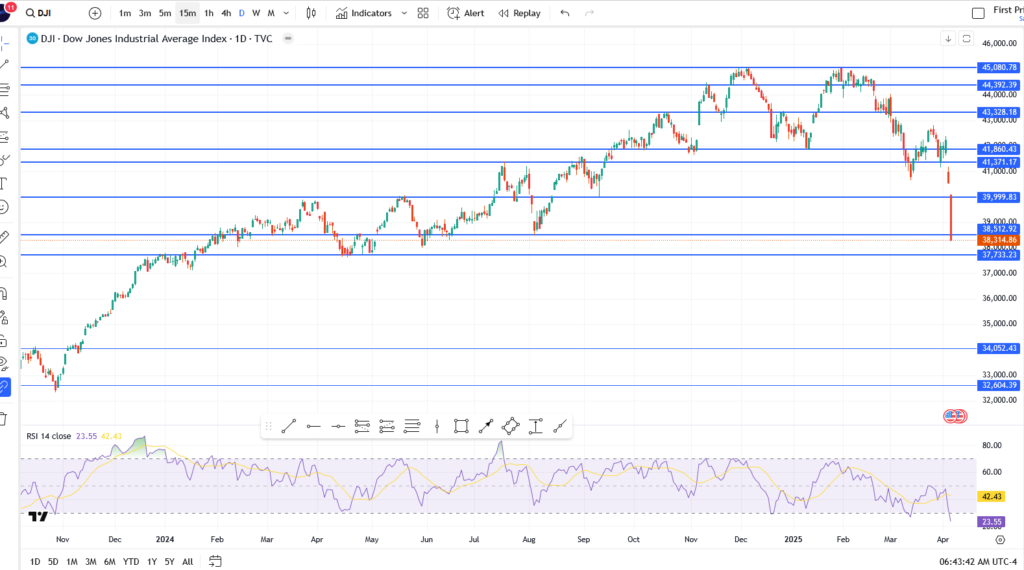
- Support breached at 41,371, triggering a cascade sell-off.
- Dow sliced below 39,999.83, confirming entry into correction zone.
- Next key support sits at 38,314.86 — the level currently holding as short-term demand.
- Below this, bears may target 37,733.23 and eventually 34,052.43, a 2023 support base.
RSI Breakdown:
- The 14-day RSI collapsed to 23.55, confirming oversold conditions and massive bearish momentum.
- Previous RSI lows have historically triggered short-term bounces, but the sentiment remains extremely fragile.

Wall Street’s Volatility Surge: Worst Since Pandemic Panic
- Volatility Index (VIX) spiked 35%, mirroring levels not seen since 2020 lockdown panic.
- Financials, Industrials, and Tech led the decline, with bank stocks hit especially hard.
- Major tech firms like Apple, Amazon, and Nvidia posted multi-day losing streaks, losing billions in market cap.
What’s Next? Bearish Momentum or Rebound Rally?
While some traders are eyeing a possible dead-cat bounce following the sharp RSI plunge, the broader macroeconomic landscape suggests that downside risks remain elevated:
- President Trump’s protectionist agenda is accelerating, with new tariffs raising fears of global trade fragmentation.
- The Federal Reserve faces mounting pressure — forced to choose between supporting growth or containing inflation amid stagflation threats.
- Institutional capital is shifting defensively, favoring bonds, gold, and safe-haven equities as uncertainty escalates.
Conclusion
The Trump tariff shock has rattled Wall Street, unleashing the worst stock market meltdown since the 2020 pandemic crash. With the Dow Jones breaking key support levels and RSI approaching capitulation territory, markets are teetering on the edge of a deeper correction.
Whether this is a short-term panic or the start of a prolonged bear market will depend heavily on upcoming macroeconomic headlines, the Federal Reserve’s policy response, and the next fiscal moves from the Trump administration.


