
- Summary:
- CNN Fear and Greed index is showing an improvement in investor confidence after the US Fed hit the pause button for the 2nd consecutive time.
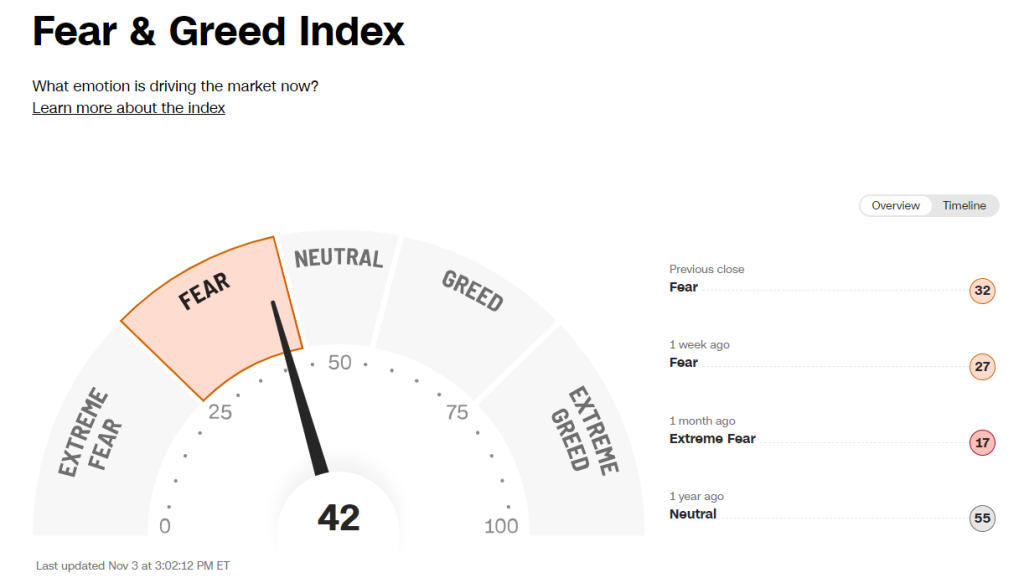
The Fear and Greed index currently stands at 36 points, which marked an 18-point increase from its October lows. A look at the timeline for the index also shows that market sentiment has been improving since 18th October as US 10-year bond yields retreat from their 15-year peak.
It seems the US Federal Reserve has halted its interest rate hike program as the central bank keeps the 5.25% rate unchanged for the second consecutive FOMC meeting. However, the chairman did warn of a potential rate hike in the future if fails to meet its 2% inflation target.
The month of October has been a rollercoaster for the global financial markets as a new war started in the Middle East. Consequently, oil prices surged from $85 to $93 in a matter of days while the 10-year bond yields also touched 5% which was their highest level since 2007. However, the market seems to have calmed down as these assets are now retreating to their pre-war levels.
The Fear and Greed Index is used by investors to measure the overall sentiment of the market. This measure is made up of 7 different indicators and is based on the principle that excessive greed usually leads to market tops, while fear has the opposite effect.
What Does The Fear and Greed Index Mean?
As mentioned earlier, the index indicates that there is fear in the market despite a slight improvement in market sentiment over the last few weeks. 6 out of the 7 indicators used to calculate the Fear and Greed index point towards fear in the market.
Of the 6 indicators indicating fear, the stock price strength and stock price breadth show extreme fear in the market as these indicators hover around their yearly lows. On a positive note, the remaining 4 indicators, while still pointing toward fear, suggest a recovery in investment sentiment as geopolitical tensions start to ease.