
Linear regression can help real estate companies and investors in their house price prediction for properties in a given location using housing data variables like number of rooms, size of the house, number of bathrooms etc. Essentially, linear regression involves getting the value of unknown data using known values. This involves assessing the strength of linear relationship between dependent and independent variables.
However, the performance of a model is only as good as the accuracy of the primary data collected. It is important not to get correlation and regression mixed up. While the former measures the strength of relationship between two variables, the later tells us how one variable affects the other.
Why use linear regression?
- Easy to interpret: Linear regression is based on a simple, straightforward concept, using a line to see how one feature affects the other variable. It clearly brings out the features’ relative importance and the degree to which they impact the prediction as a whole.
- Provides a baseline for complex models: Linear regression can be used to assess the reliability of more complex models. The rule of thumb is that a complex model may be overfitting the data if it fails to provide substantially better outcomes than linear regression.
- Easy to understand and implement: linear regression is relatively easy to implement and understand. Because of this, it is an excellent way for beginners to start learning.
Building a linear regression model for house price prediction
In the case of the real estate market, we can do house price prediction based on features like its size, number of bathrooms etc, and it is possible to develop a model based on these features. In order to identify the general market trend, the model attempts to fit the data points to a straight line. We can estimate the price of houses of a certain size can by drawing an extension of this line.
When other factors change, the independent variable stays the same. However, when the independent variable fluctuates, the dependent variable shifts as well.
Linear regression is the simplest form of regression, and it presupposes a linear relationship between the dependent and independent variables. It is based on the equation y=mx+b, where y is the dependent variable, x the independent variable, m the slope, and b the intercept.
We can employ linear regression to derive rough estimates of house prices from their sizes, number of bathrooms, location etc simply by fitting the data to a straight line. Here we see supervised learning in action, whereby we train a model to predict quantitative outputs using known data.
Plotting data
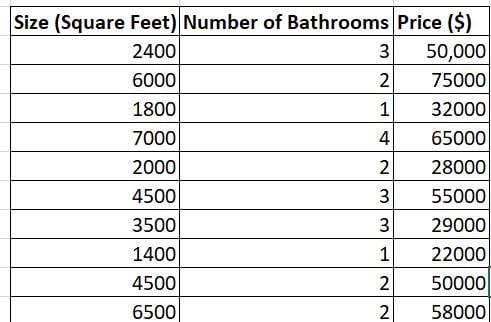
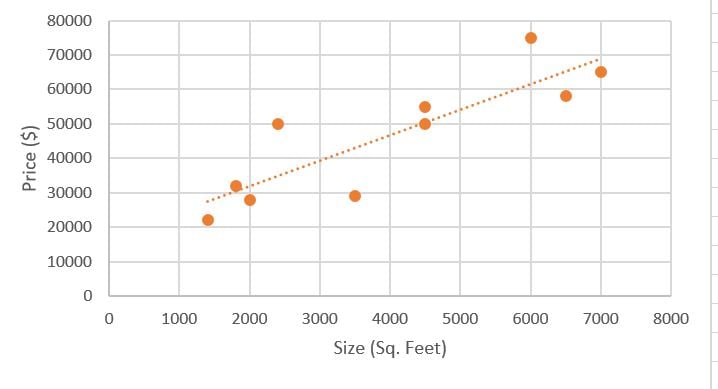
First things first-in linear regression, we plot the dependent variables are on the Y-axis and the independent variables on the X-axis. On the table below, we look at the variation of number of bathrooms, house sizes and the prices. Here, the house size and the number of bathrooms were the independent variables, while the prices were the dependent variable. On this occasion, we plotted the house sizes against the prices. Once the the line of best-fit falls into place, the model can utilise the features to forecast the price of new homes.
Supervised learning
Supervised learning is an approach to machine learning which involves training a model using a labelled dataset. In our dataset, we have input features like the number of bathrooms, the size of the house etc which we use to get the corresponding output targets, i.e. the house prices. These inputs are used to train the model to produce accurate forecasts using newly injected data.
Limitations of linear regression
The relationship between housing sizes and price is an example of an assumption made by linear regression, which assesses things in a pretty straightforward manner. That said, you linear regression may not be the best technique to use if you are dealing with complicated issues. This may present a challenge when, for instance, one gives more importance to factors like a house’s location, tax implications, and proximity to a recreation area, etc.
Also, often some of the data collected is noisy. In addition, a dataset can contain outliers, inaccurate data, or blank fields. Data of this nature may affect the accuracy and reliability of the model’s predictions. Therefore, it is crucial to exclude any data that is noisy.
In addition, our y=mx+b formula cannot integrate nominal variables that impact home values. As an example, since location is a nominal quality, we are unable to incorporate it into our prediction model, despite the fact that it is one of the key factors that influence the price of property.
Therefore, in order to work with nominal attributes, you must first transform them into quantitative attributes by converting them into ratio scales. In our case, we must find the price per square foot for each house then sort them by region and find the median for each group. By doing this, you can transform a nominal attribute, such as location, into a ratio-scaled attribute.
Conclusion
House price prediction using linear regression is a straightforward but effective technique that investors can adopt. You only need to ensure that you collect data that is accurate and without noise. Furthermore, you can use linear regression in machine learning and achieve even better outcomes, because of its proven effectiveness and simplicity. Even better, linear regression has a solid scientific foundation and has been shown to be a reliable trend predictor.