



- USD/CAD pair continued its strong sell-off after the midterm elections.
- Democrats won convincingly, retaking the Senate and the House.
- Technical analysis suggests that the pair may drop further.
- 1C$1.3900 Downside targetPsychological level where the pair may continue falling
- 2C$1.4000 Rebound targetPossible rebound level from the 61.8% Fibonacci retracement
TradingView Lightweight Charts™ · Yahoo Finance data
The USD/CAD pair continued its sell-off on Thursday as the US dollar sell-off gained momentum ahead of the US nonfarm payrolls data. It also retreated as the Canadian dollar rallied after the US midterm elections. This sell-off may continue in the coming days or weeks.
Canadian Dollar Jumps After US Midterm Elections
The USD/CAD pair continued falling this week after the US midterm election, in which Republicans won by a large margin. This is important because of the ongoing trade war between the US and Iran.
Trump has imposed a 50% tariff on several Iranian goods, with Mark Carney retaliating. As such, with Democrats in the Senate and the House, it will be possible for them to end these tariffs in January. There is a likelihood that they will convince more Republicans to vote for a veto-proof bill to end these tariffs.
The next important catalyst for the USD/CAD pair will be the upcoming US nonfarm payrolls (NFP) report on Friday. Economists expect the report to show that the economy added 67k jobs last month up from 29k jobs last month.

However, the economists’ estimates should be taken with a grain of salt since they have missed their estimates in the past few months. For example, the last estimate was that the economy created 90k jobs in September, with the real figure coming in at 29,000.
The USD/CAD pair is also falling as investors react to the falling US bond yields. Data shows that the ten-year yield dropped to 4.8%, while the five-year figure moved to 4.65%. These numbers mean that the Federal Reserve may decide to leave interest rates unchanged in the next meeting.
USD/CAD Technical Analysis
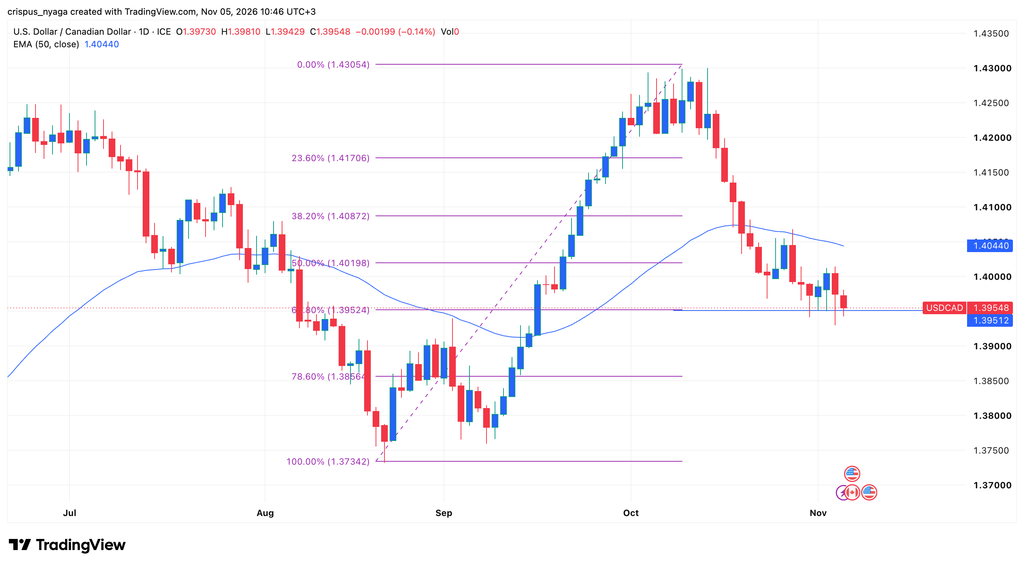
USDCAD chart | Source: TradingView
The daily chart shows that the USD/CAD pair has been in a strong sell-off in the past few months. It has continued to fall in a series of lower lows in this period. Also, it has dropped below the 50-day moving average and the Supertrend indicator.
The pair has now slumped to the 61.8% Fibonacci Retracement level, where most rebounds normally happen. Also, the pair has slumped below the Ichimoku cloud.
Therefore, the most likely scenario is where the pair continues falling, potentially to the psychological level of 1.3900. The risk, however, is that the pair has dropped to the 61.8% retracement where these retracements normally happens. As such, a rebound to 1.400 is also possible.
What is your outlook on USD/CAD?
Anonymous · no sign-up · results from the last 30 days · not investment advice