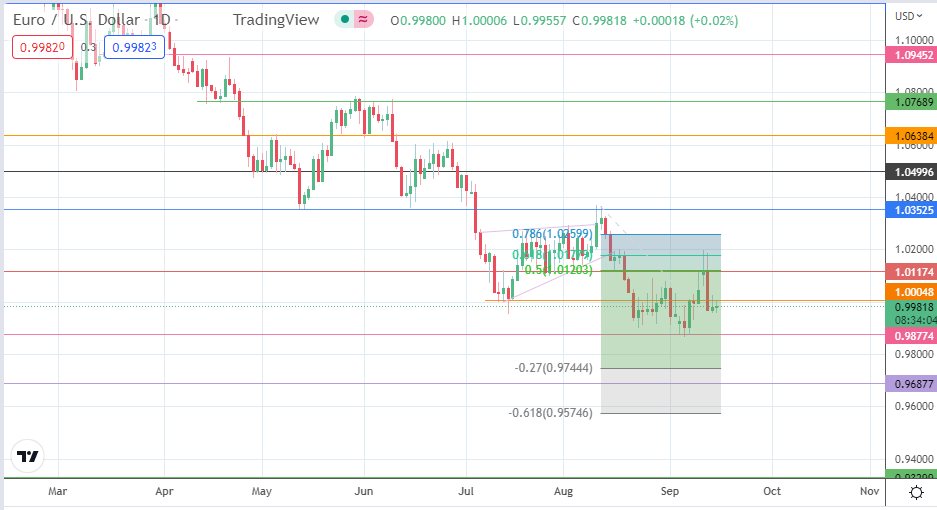
The EUR/USD pair is trading higher today and looks set to retain the second day of consecutive gains. However, some dollar tailwinds may prove to be a capping factor at parity if the news and price action are anything to go by.
Inflation data released earlier in the week had put the pair on offer on Tuesday, as it prompted renewed bets of aggressive Fed action when it concludes its two-day meeting next week, culminating in the 21 September interest rate decision.
The Eurozone governments are mulling placing a cap on energy bills. Economists at ING predict that the pair will remain below parity in the coming days, as the 2-year swap rate differential has widened in the dollar’s favour. ING’s economists see two scenarios. The first scenario sees the move as dampening inflationary pressure, allowing the ECB to adopt a more dovish stance.
A second scenario sees little impact of this move, which would tend toward more tightening. The US fundamentals are seen as the primary driver of price action, favouring an endpoint at parity or below ahead of the FOMC decision. The market awaits the US Retail Sales report and the Empire State Manufacturing Index.
The day’s uptick has met resistance at the 1.00048 price mark (12 July low and 7 September high). A break of this resistance sends the pair toward the 1.01174 barrier, which is the 50% Fibonacci retracement level from the swing high of 11 August to the swing low of 6 September.
Additional upside targets are at the 13 September high, which is the 61.8% Fibonacci retracement that nestles at 1.01783, and the 1.03525 price barrier, which is formed by the previous low of 12 May and the prior high of 10 May.
On the flip side, a rejection at the 1.00048 resistance allows for a potential pullback move, which targets the 7 September low at 0.98774. A breakdown of the 0.98774 support clears the way for a march towards two-decade lows. The 27% Fibonacci extension at 0.97444 and the 0.96877 support (17 October 2002 low) form new targets to the south.


This post was last modified on Sep 15, 2022, 14:54 GMT+0100 14:54