
Suzlon Energy’s stock has faced selling pressure this week despite reporting a 91% YoY jump in net profit for Q3 FY25. The stock opened at ₹54.96 but quickly fell to an intra-day low of ₹52.32, mirroring the broader market’s volatility. With a 20.4% gain in the past year, investors are questioning whether Suzlon can sustain its bullish trend.
Suzlon Share Price Chart Analysis – Key Levels to Watch
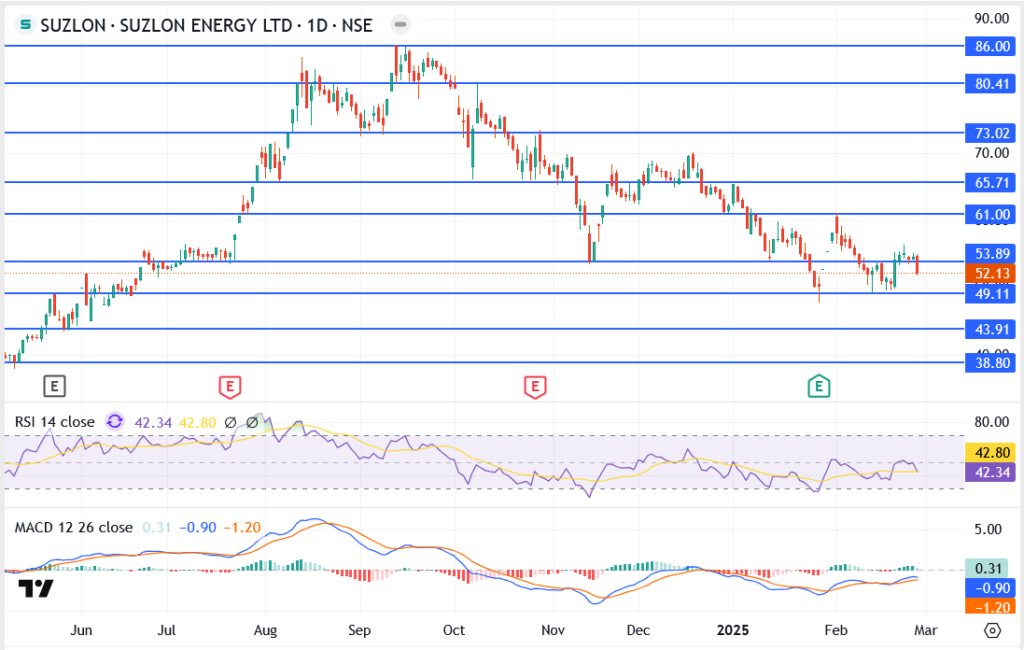
- Resistance Levels:
- 53.89 – Immediate hurdle; needs a breakout to regain momentum.
- 61.00 – 65.71 – Strong resistance zone; breaking this could trigger a rally.
- Support Levels:
- 49.11 – Critical support; a breakdown could invite more selling.
- 43.91 – 38.80 – Key demand zones; holding above these is essential for stability.
Latest Suzlon News & Market Trends
Suzlon secured a 201.6 MW deal with Oyster Renewable and expanded its total project size in Madhya Pradesh to 283.5 MW. Financially, the company posted a 91% YoY net profit jump to ₹388 crores. However, broader market weakness has kept Suzlon’s stock under pressure, raising questions about its near-term momentum.
Suzlon Share Price Outlook – Can Bulls Regain Control?
Suzlon’s stock must hold above ₹49.11 and reclaim ₹53.89 to confirm a recovery. A break above ₹61.00 could fuel a stronger rally.
However, if selling continues, ₹43.91 could be the next downside target. With strong earnings, growing renewable energy deals, and a solid long-term outlook, Suzlon remains a stock to watch—but short-term volatility could keep traders on edge.