- Summary:
- Bitcoin price is on a seven-day winning streak but the USD 100,000 mark seems likely to present a hurdle if the current momentum persists.
Bitcoin Price teased the $100,000 mark on Monday as it led a wider market rally. According to data aggregation site, CoinMarketCap, the crypto market sentiment has entered the “Greed” territory, signaling a higher risk appetite and the likely extension of gains. Also, the crypto market capitalisation has gained more than $300 billion since the turn of the new year and stood at $3.52 trillion as of this writing.
BTC is on a seven-day winning streak and has gained more than 6% in that time frame. However, the coin has also formed a double-bottom pattern on the daily chart, signaling a potential resistance at the $100k mark. Bitcoin price has been consolidating below that mark for the past three weeks and a breakout above it could signal an impending stronger market rally.
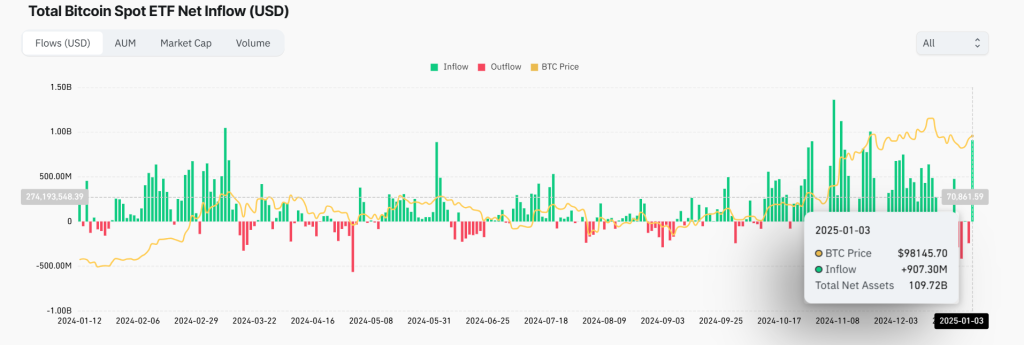
Bitcoin’s resurgence is accompanied by a spike in its ETF performance. According to Coinglass, Bitcoin spot ETF inflows rose to $907.30 million on Friday after recording losses in six of the previous seven trading sessions. iShares Bitcoin Trust (IBIT), the largest of the 11 Bitcoin ETFs rose by $252 million in the session,

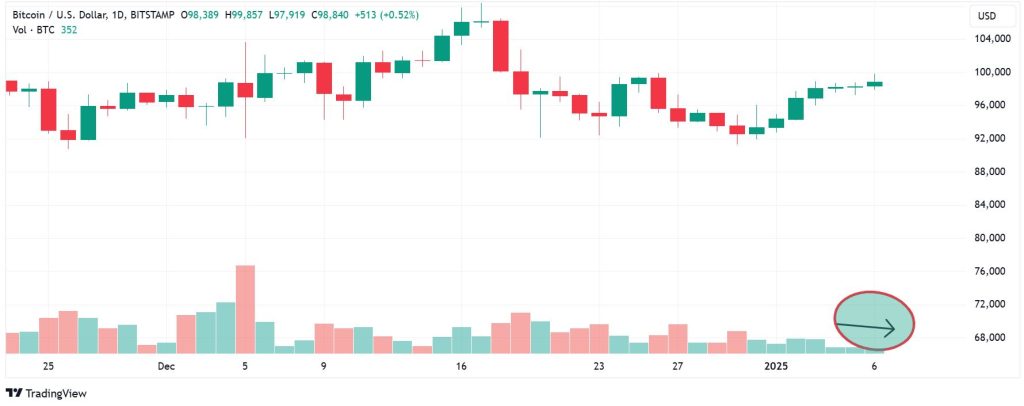
Notably, Bitcoin price rise is accompanied by a near-stagnation in the asset’s traded volume. As seen on the chart below, the coin’s traded volume has changed marginally in the last three days. That signals a weakening upward momentum, with investors taming their appetite for BTC. A continuation of the trend could lead to a reversal of the current upside trajectory.

Bitcoin price prediction
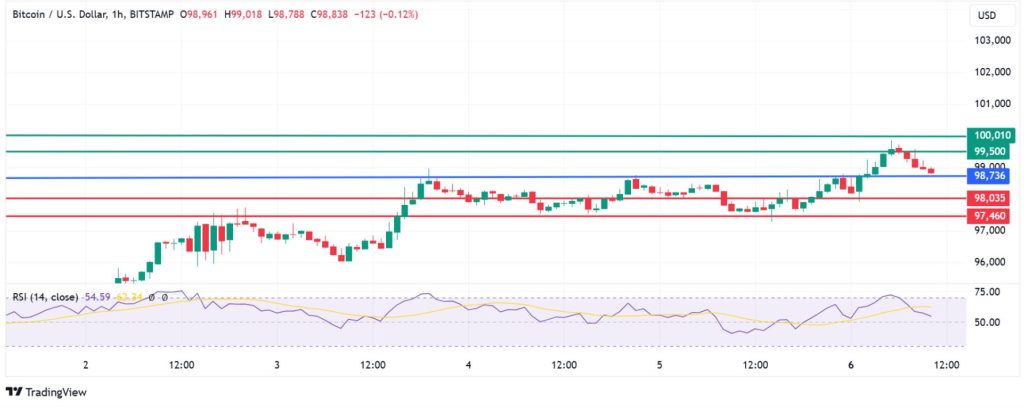
Bitcoin price pivots at $98,736 and the upside will continue if the price action stays above that level. That could see the asset move higher and encounter the first resistance at $99,500. A stronger upward momentum will break above that level and potentially test $100,010. Moving above that level could potentially trigger a rally.
On the other hand, moving below $98,736 will shift the momentum to the downside, with the first support likely to be at $98,035. Breaking below that level will invalidate the upside narrative. Also, an extended control by the sellers could trigger more losses and establish the second support at $97,460.


