
MicroStrategy’s (NASDAQ: MSTR) stock took a brutal hit yesterday, plunging 11% as Bitcoin’s price tumbled. However, in a twist, MSTR is up 3% in pre-market trading, signalling that dip buyers might be stepping in. The big question now: Is this a dead-cat bounce, or are bulls ready to reclaim control?
MicroStrategy Stock Chart Analysis – Key Levels to Watch
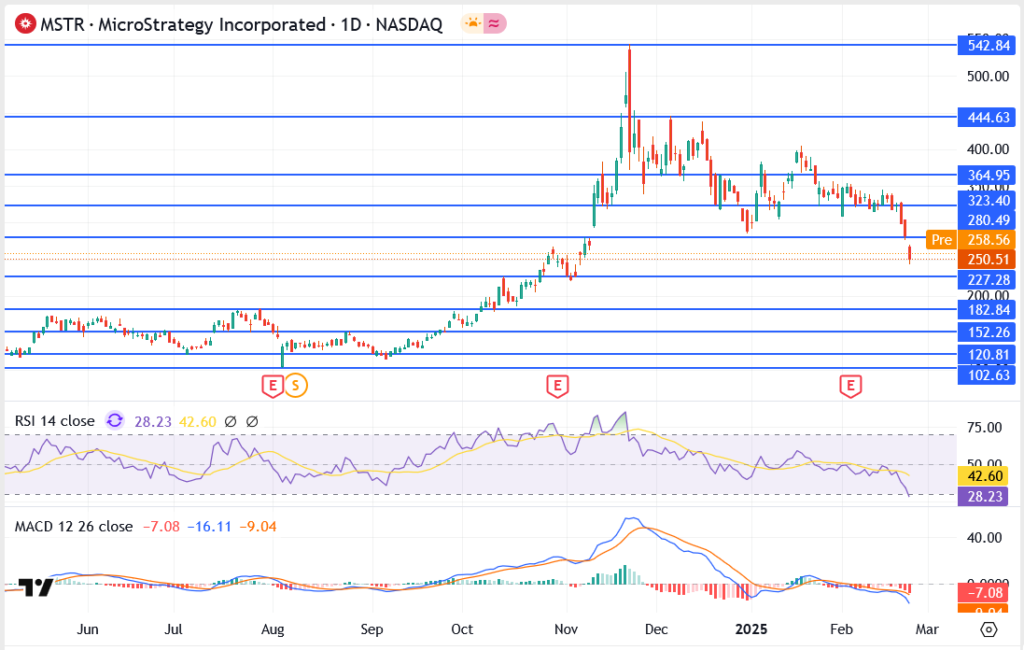
- Resistance Levels:
- 258.56 – Immediate pre-market resistance; a break above could trigger more upside.
- 280.49 – 323.40 – A heavy supply zone where sellers could return.
- 364.95 – A critical level to confirm bullish momentum.
- Support Levels:
- 250.51 – The stock is hovering around this level; a break below could invite more selling.
- 227.28 – 200.00 – Strong demand zones that could act as support if the decline continues.
- 182.84 – 152.26 – Extreme downside targets in case of further weakness.
Why is MicroStrategy Stock Falling?
Bitcoin’s price crash. As BTC dipped below $90,000, concerns arose over potential forced liquidations of highly leveraged positions. Since MicroStrategy is the largest corporate holder of Bitcoin, its stock moves almost in sync with BTC’s volatility.
MSTR Outlook – Bounce or Breakdown?
With a 3% pre-market rebound, bulls are attempting to reclaim lost ground. However, the stock must break above 258.56 for any sustained recovery. Failure to do so could see another retest of 250.51 or even 227.28.
If Bitcoin stabilizes, MicroStrategy could see a sharp short-covering rally. But if BTC slides further, expect more blood in MSTR. The next few sessions will be make-or-break for investors.