- Summary:
- Explore key support and resistance levels, recent price action, and the factors driving Meta performance in the tech sector.
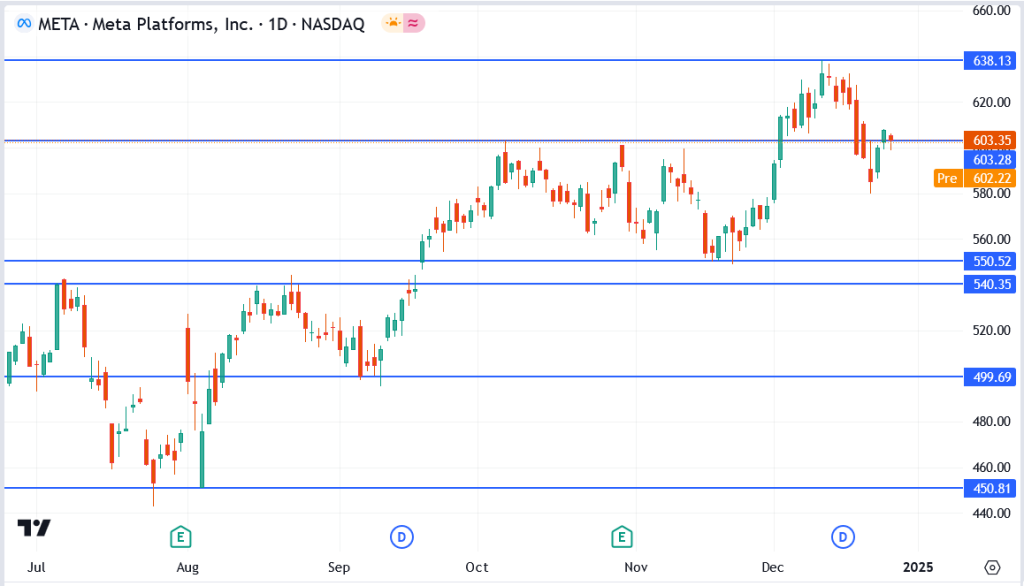
Meta Platforms Inc. (NASDAQ: META) is holding steady at $603.35 after a strong rally earlier this year. The stock is consolidating, with technical levels hinting at its next direction. META remains a standout in the tech sector, fueled by rising ad revenue and virtual and augmented reality innovation.
Chart Analysis: Key Levels to Watch
The daily chart provides a clear picture of META’s current price action:
- Current Price Zone: $603 – META is hovering around this level, signaling a period of consolidation after a recent rally.
- Immediate Resistance:
- $638 – A breakout above this level could pave the way for further bullish momentum.
- Immediate Support:
- $603 – This level is critical for maintaining the uptrend.
- $550 – A deeper correction could see prices retreat to this support zone.
- Long-Term Support:
- $499 – This level represents a strong foundation if bearish sentiment intensifies.

What’s Driving META?
The company’s pivot towards AI-powered ad targeting and its dominance in social media platforms like Facebook and Instagram have kept it at the forefront of investor interest.
Outlook for META Stock
META’s next move will depend on whether it can break above key resistance at $638. A prolonged rally may draw additional investor interest, whereas a drop beneath $603 could prompt a reexamination of lower support levels. Investors need to closely monitor these technical indicators as 2024 approaches its end.


